Actually, this is not a joke file, if anything the joke is I actually took a bunch of time to figure this out. (I've been kind of wondering about it since all the 'flat rate tax' hubbub before our Presidential elections last November).
Okay, as we're receiving our forms in the mail saying how much tax we've paid, have you ever caught yourself wondering what percent of your income you actually PAY in taxes?
Well, if you're like me, you just put all your money, the shirt off your back and shave half your cat, throw it all in the envelope and send it to the IRS. (Or, in my case, part of it goes to the California Tax Franchise Board. (Not a very catchy name))
So, I'm single and have no dependents, so I claim one exemption (me) and the standard deduction on my income tax forms. This is basically the maximum tax you can pay (mmmm, lucky me).
But there's more to the picture than that. How about income taxes for Social Security and Medicare? With all the tax brackets and ranges things apply to, it's hard to really say what the actual percentages are.
I started thinking about it when somebody from a different country asked how much Americans pay in taxes. I guessed a little under 40% of our income, typically. (but I was also including the 7% matching that your employer pays in Social Security for you that they don't tell you about which is in addition to the 6.2% they show on your deductions)
But in an incredibly nerdy quest for the truth, I prepared 150 lines of C code to calculate it, and many hours researching the tax forms.
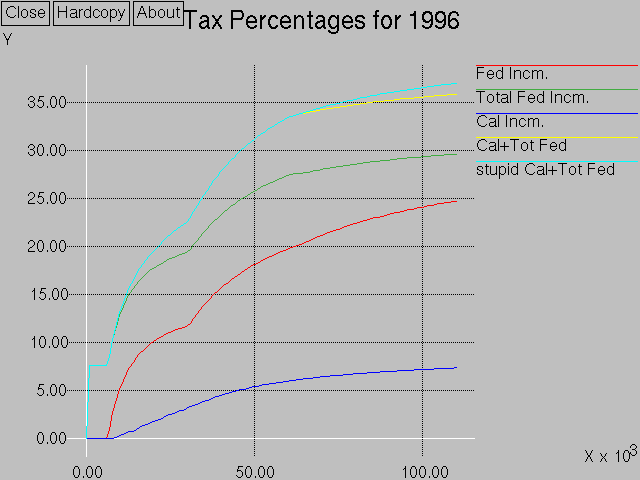
Below is a graph of the income tax percentage rate an American pays based on his income level. This does not include various sales taxes, property taxes, vehicle taxes and other non-income taxes. It also does NOT include deductions for property taxes and mortgage payments which can be a substantial savings in income taxes unless you're like me and you rent in which case this is it for you, pal.
Also, the rules for deductions get very fuzzy around $120k per year income. We have two more tax brackets at the federal level of 36% (over $120k income) and 39.6% (over $264k income) which are not represented on the graph because I think it would be really meaningless. At those levels people are itemizing all kinds of deductions until the deduction limit around $220k and there is a formula for ratioing the deduction blah blah blah and I gave up on it after wading through a big pile of IRS forms for a long time... (ugh)) (SO I avoided the whole problem by just displaying up to $110k/year)
Anyway, this is what's on the graph:
Hope you find this kind of interesting!!
-Dave Pietromonaco
(Disclaimer: while I believe the information to be accurate, the final reference for your American taxes is of course the American Federal Government, namely the Internal Revenue Service)
(Clicking on the Graph above downloads the full size version which is 1211x864, but only 18k in size so it downloads quickly)
X axis is income in US dollars, Y axis is Tax as a Percentage of Income